Every Friday, someone on your team spends 30–90 minutes pulling numbers from five different tools, pasting them into a template, writing a summary, and sending it to the group. That's 50–75 hours per year of work that could be done in 30 seconds — automatically.
Why weekly reports get automated last (and shouldn't)
Most teams automate customer-facing processes first — emails, notifications, order confirmations — and leave internal reporting as manual work. This is backwards. Automated reporting has no downside risk (no customer sees it), is highly repeatable (the same data, the same format, every week), and delivers immediate ROI in reclaimed time.
A weekly report that used to take an hour can run in under a minute with automation. The report is more accurate (no copy-paste errors), more consistent (same format every week), and available earlier (sent automatically at 9am Friday instead of whenever someone gets around to it).
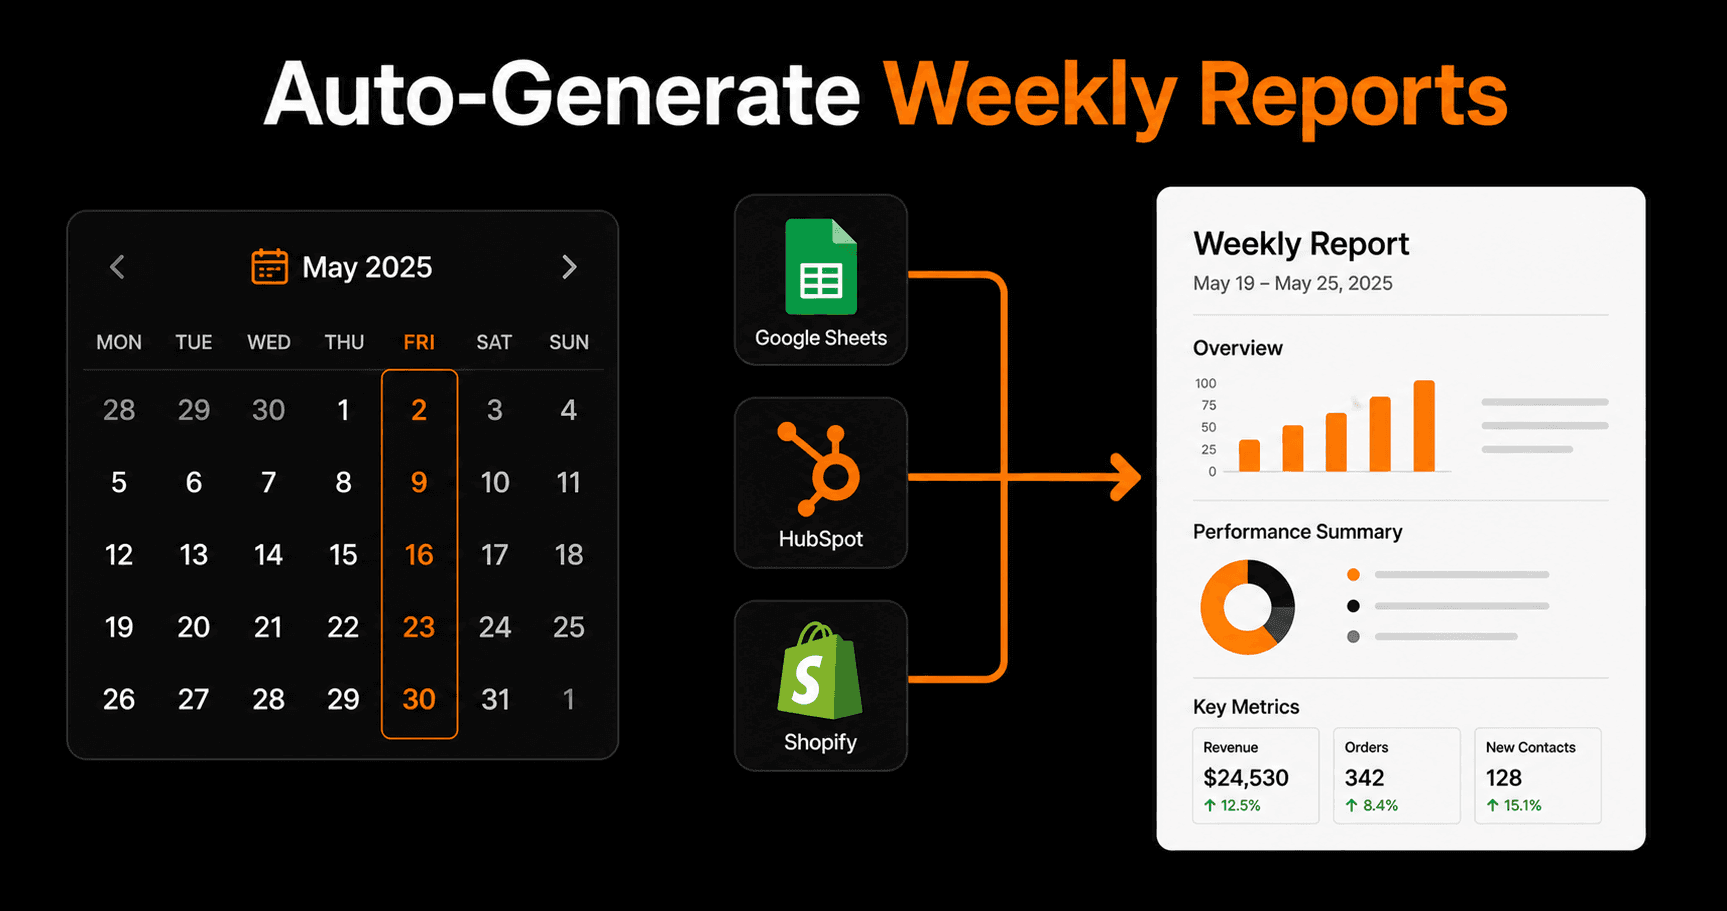
What a good automated weekly report includes
The best weekly reports are brief and action-oriented. They answer: What happened this week? What's on track? What needs attention? Include:
- Revenue numbers: weekly total, month-to-date, comparison to last week
- Lead and pipeline metrics: new leads, deals closed, pipeline value change
- Operational metrics: orders processed, tickets resolved, tasks completed
- Key exceptions: anything significantly above or below target
- 1–3 action items: what needs a decision or attention this week
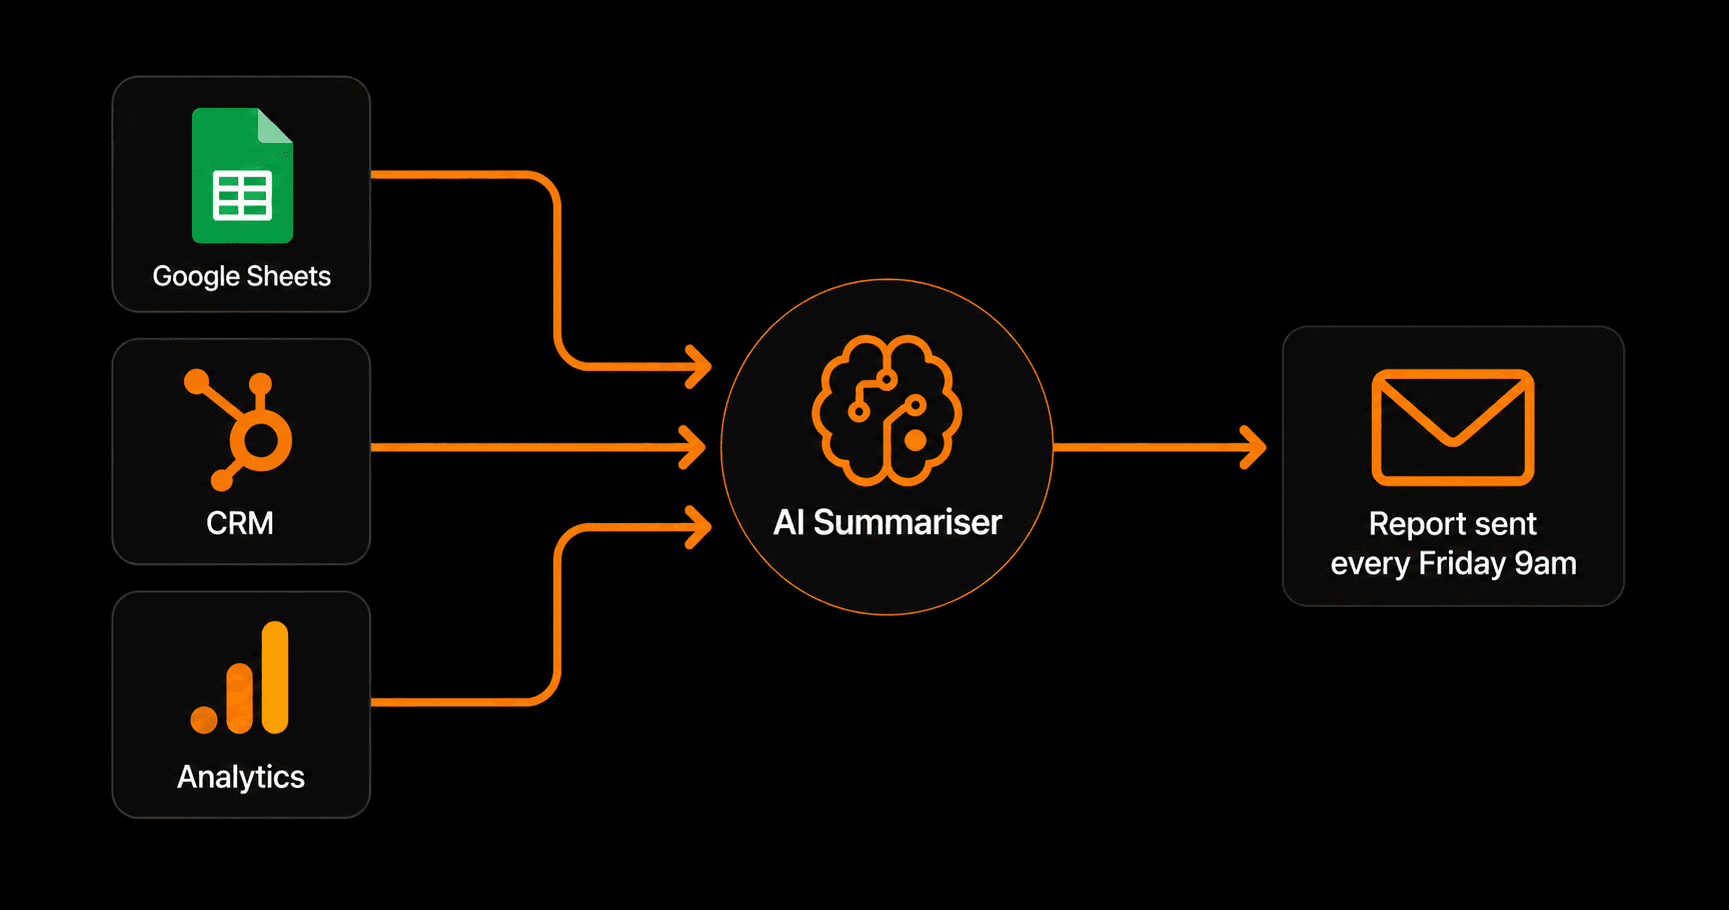
Raw data from multiple sources → AI summarizer → polished report in your inbox
Building the automated report workflow
Step 1: Define your data sources
Most weekly reports pull from 2–4 sources. Common combinations:
- Google Sheets (manual tracking) + HubSpot (deals) + Shopify (revenue)
- Airtable (project tracking) + Google Analytics (traffic) + Mailchimp (email metrics)
- Notion database (tasks) + Linear (dev tickets) + Stripe (revenue)
Identify exactly which numbers go into your report and which tool each one lives in.
Step 2: Create a data collection workflow
Build a workflow that runs every Friday at 8:30am and reads the current values from each source. For Google Sheets, this is a read_rows action. For HubSpot, this is a contact/deal count. For Shopify, this is an order summary.
All collected values are stored as workflow variables for the next step.
Step 3: Add the AI summarizer
Pass all the raw numbers to an AI node with a prompt like: “You are a business analyst. Here is this week's data: [variables]. Write a concise weekly report in bullet points with: this week's highlights, what's behind target, and 2–3 recommended actions for next week. Keep it under 200 words.”
The AI turns raw numbers into an executive-readable summary in seconds.
Step 4: Format and send
Send the report via email (Resend or Gmail) and/or Slack. For email: use an HTML template with your company logo and consistent formatting. For Slack: post to a dedicated #weekly-report channel so it's easy to find in the archive.
How to build this in Vendarwon Flow
- Connect your data sources. Authorize Google Sheets, HubSpot, Shopify (or whatever you use) in the Integrations tab.
- Create a scheduled workflow. Set the trigger to “Every Friday at 8:30am.”
- Describe the workflow. “Every Friday at 8:30am, read this week's sales data from Google Sheets (tab: Weekly Data, columns: Revenue, New Customers, Orders), read the new deals from HubSpot for the past 7 days, then use AI to generate a 150-word weekly summary report and send it to my team email and to Slack channel #weekly-reports.”
- Test on demand. Use the manual trigger to fire the workflow right now and check that the data reads correctly and the email looks right.
- Activate. It runs every Friday from now on with zero intervention.
Advanced: dynamic benchmarks and anomaly alerts
Once the basic report is running, add intelligence:
- Condition node: if revenue is more than 20% below last week's, flag it in red in the report and send an immediate Slack alert instead of waiting for Friday
- Trailing averages: store last 4 weeks of data in a Google Sheet and have the AI compare this week to the 4-week average automatically
- Goal tracking: include monthly targets in your Sheet and have the AI calculate whether you're on track to hit them
Frequently asked questions
What if my data changes between when it's read and when the report is sent?
For weekly reports this is rarely a meaningful issue — the report captures a snapshot as of Friday morning. If you need real-time accuracy, add a second data read step that runs 30 minutes before sending as a final check.
Can I send different reports to different people?
Yes — build conditional branches based on recipient role. Your executive summary goes to leadership (shorter, revenue-focused). Your operational report goes to the operations team (longer, task and process metrics). Your marketing report goes to marketing (traffic, leads, email performance). One workflow, multiple outputs.
How do I handle weeks when the data sources are unavailable?
Add error handling with the “error” edge label in your workflow. If a data source read fails, the error branch sends you a Slack notification: “Weekly report failed — HubSpot read timed out. Please run manually.” You always know when something went wrong instead of quietly missing a report.